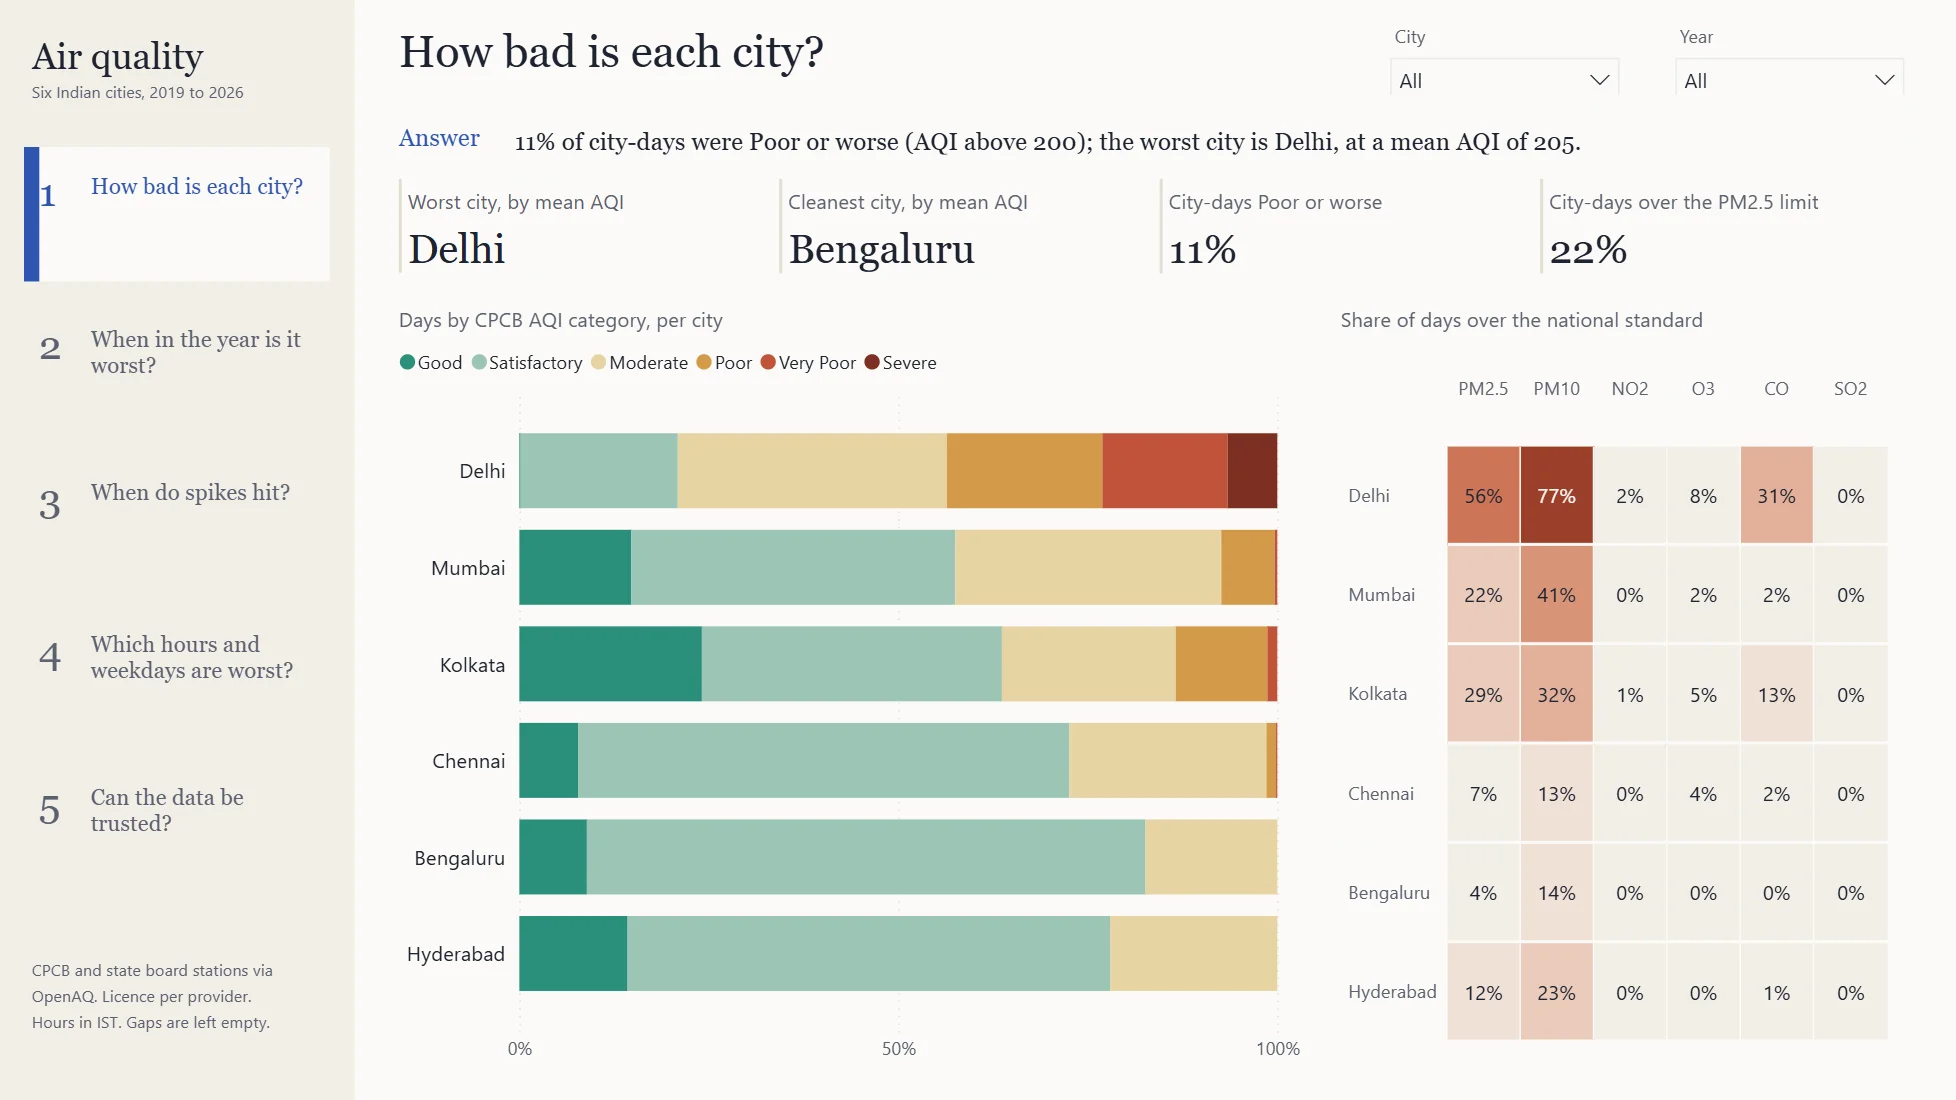
Government air-quality monitoring in Delhi, Mumbai, Kolkata, Chennai, Bengaluru and Hyderabad, hourly from 2019 to September 2026. The first piece in this series built on real data rather than a simulation: every problem in the source is found, counted and handled, and nothing is filled in.
The earlier pieces in this series simulated their data and graded the analytics against a sealed answer key: that proves the method, not the world. This one uses real measurements from 107 government monitoring stations (CPCB and state boards, via the public OpenAQ archive) in six cities. There is no answer key, so every number has to survive the source.
The archive has no Indian station data from 31 Oct 2022 to 19 Feb 2025: 27 months, left blank and never estimated. Later files label NO2, SO2 and CO as ppb, but the values are CPCB's own µg/m³ and mg/m³: 12,171,979 readings relabelled, not converted. PM value 985 is an analyser status code (22,707 readings at exactly 985, 15 at 984). 5,890 runs of a frozen value last 8 hours or more, and at two stations an old and a new OpenAQ id publish different values. In all, 1,089,800 readings are set aside, each under a named reason.
The stations were found from the archive itself, with no account or API key: 117,993 daily files (337.4 MB), each MD5-verified and listed in a manifest. 56,030,781 raw rows go into a DuckDB star schema, where every reading gets exactly one disposition, valid or a named issue, and only valid readings reach the facts. The marts score CPCB's National AQI, exceedance of the national standards, seasons, hourly profiles and spikes. An Excel workbook and a 5-page Power BI report are generated from the same warehouse; the report is a question rail, and each page opens with a one-sentence answer computed by a measure.
23 of 23 reconciliation checks pass, and the export is blocked if any fails; 23 of 23 deliberate breakages are caught. 423 of 423 figures on the report match independent SQL, and 56 of 56 measures evaluate. 305 of 305 single lines, 36 of 36 wrapped texts and 14 of 14 grids are measured to fit. Two builds from the raw files give 18 of 18 byte-identical output files.
The worst city-month was Delhi in November 2021: mean AQI 401, with 30 of 30 days Very Poor or Severe. City PM2.5 was above the 24-hour national standard on 56.5% of measured days in Delhi and 3.6% in Bengaluru. Delhi's October-November PM2.5 runs 3.3x to 5.3x its September; with no weather or emissions data, levels are described and no cause is attributed. 79 short spikes were found from the data alone, starting most often in October.