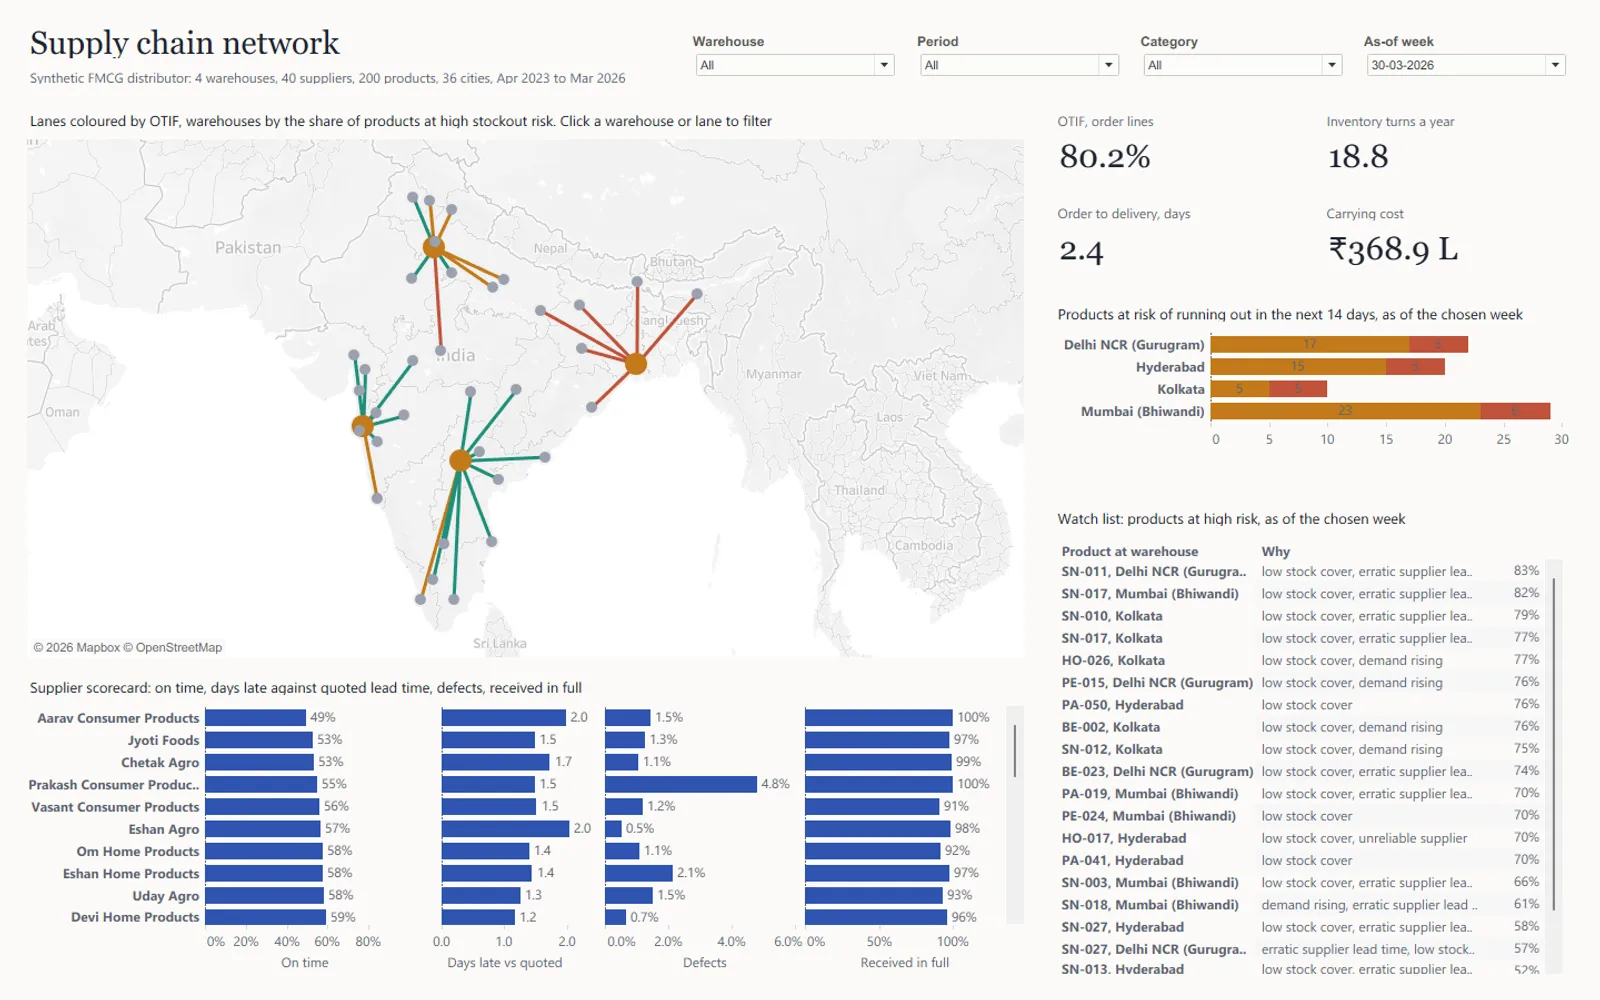
Three years of a synthetic Indian FMCG distributor: on-time-in-full, lead time, inventory and supplier performance in DuckDB, a 14-day stockout model that beats the reorder-point rule, and a Tableau workbook generated from code.
A distributor's view of its network is split across order books, warehouse stock and supplier records. The questions that matter cross all three: which lanes deliver on time and in full, where stock runs out next, and which supplier is causing it.
A day-by-day simulation of a synthetic distributor, April 2023 to March 2026: 4 warehouses (Hyderabad, Mumbai, Delhi NCR, Kolkata), 40 suppliers, 200 products and 36 delivery cities, with Diwali demand, monsoon lane delays, a supplier that starts slipping in July 2024 and a festive pre-build from September 2025. Plain SQL in DuckDB models OTIF, lead time, inventory turns and carrying cost. The Tableau workbook is generated from code; clicking a warehouse or lane on the map sets the whole dashboard.
15 checks gate the build, including an exact day-to-day stock balance, and each one is proven by breaking the data on purpose; two full rebuilds produce identical files. The 14-day stockout model (gradient boosting) reaches ROC AUC 0.840 against 0.699 for the reorder-point rule; flagging the same share of products as the rule, it catches 65.6% of stockouts against 59.5%. Dashboard numbers were checked against DuckDB for the whole network and two filtered views.
Kolkata delivers on time and in full 59.0% of the time against 83 to 87% at the other warehouses, held back by dispatch waits and monsoon lanes. One snacks supplier fell from 75% to 40% on time after July 2024, with the highest defect rate. A festive pre-build cut snacks out-of-stock days from 4.2% to 1.6% for about 16% more stock from September to November.