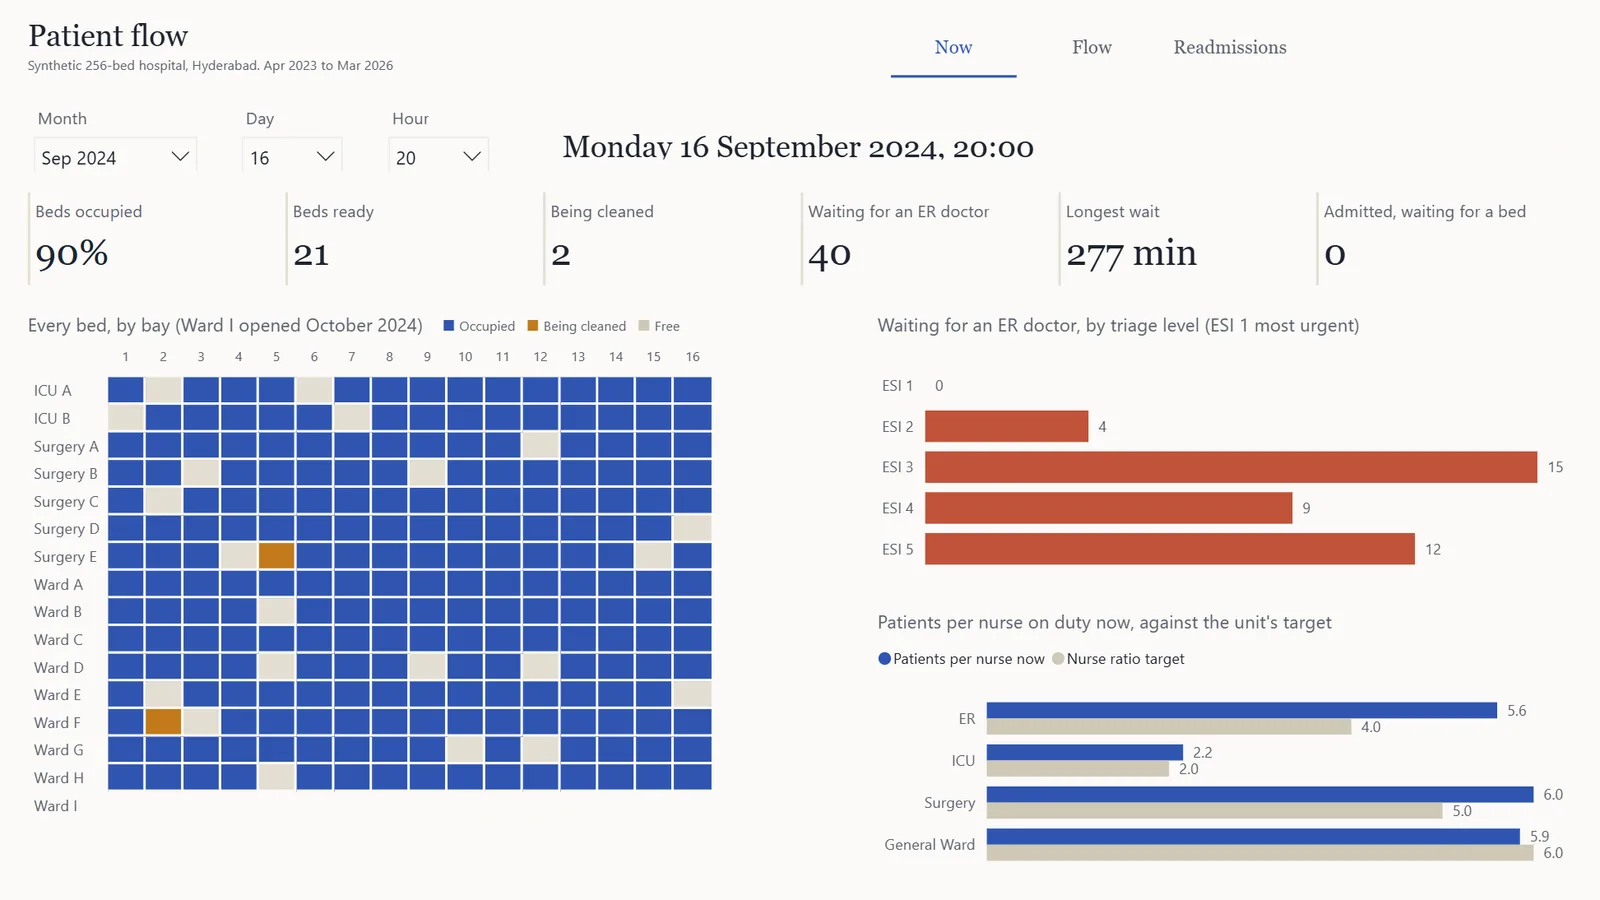
Three years of a synthetic 256-bed hospital in Hyderabad: patient flow, bed occupancy and 30-day readmissions in DuckDB, a readmission model that beats the clinical LACE score, and a Power BI report generated from code.
Hospital data answers narrow questions in separate systems: the ER board, the bed census, the discharge summaries. The questions that matter cut across them: where patients wait and why, how full the beds really run, and who is likely to be back within 30 days.
A seeded event simulation of a synthetic 256-bed multi-specialty hospital, April 2023 to March 2026: an ER doctor queue ordered by triage acuity, patients who leave without being seen, beds that need cleaning, ICU step-down, ward overflow into surgical beds, and readmissions that come back through the ER. About 168,000 ER visits land in nine raw exports. Plain SQL in DuckDB models flow, occupancy and readmissions, and the Power BI project (three pages: Now, Flow, Readmissions) is generated from code.
18 checks gate the build, each proven by breaking the data on purpose. 63 of 63 numbers on the report match DuckDB, and two full rebuilds produce identical files. The readmission model, tested out of time, reaches ROC AUC 0.786 against 0.749 for the LACE score; flagging the same share of patients as LACE, it catches 51.4% of readmissions against 47.4%.
Evening arrivals waited a median 93 minutes for a doctor in FY 2024-25; after an extra evening doctor from April 2025 that fell to 32. Patients sent home from a unit 95% full or more came back 14.3% of the time, against 12.3% from a unit under 85% full.